
Emissions Management Software for Real-Time Operational Insight
NevadaNano’s cloud-based emissions management software gives teams a single place to understand emissions, investigate individual events, coordinate an informed response, establish a performance baseline, and create reliable emissions records.
One Platform to Understand, Investigate, Act, and Report
Bring continuously measured field data, advanced analytics, alerts, historical trends, and reporting together in one platform—creating a consistent view of emissions performance across the organization.
Understand
See active emission events and performance across individual assets, sites, regions, or the entire enterprise.
Investigate
Examine the location, severity, leak-rate behavior, and history of an individual emission event.
Act
Prioritize events and automatically alert the appropriate teams based on defined thresholds and areas of responsibility.
Report
Establish an emissions baseline, track progress, document uptime, and create configurable reports using continuously measured data.
UNDERSTAND
See Where Attention Is Needed Across Your Operations
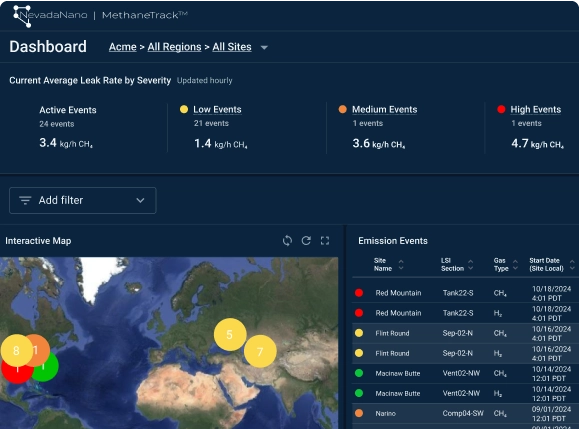
A centralized KPI dashboard provides a clear view of active emission events and their potential impact, helping teams quickly identify which sites and assets require further investigation.
- View active events by severity and CO₂e.
- Navigate from enterprise-level KPIs to individual regions, sites, and assets.
- Compare emissions performance across different areas of responsibility.
- Apply clear leak classifications to create a consistent understanding of event severity.
- Give operations, environmental teams, and management access to the information most relevant to their roles.
INVESTIGATE
Investigate Individual Emission Events
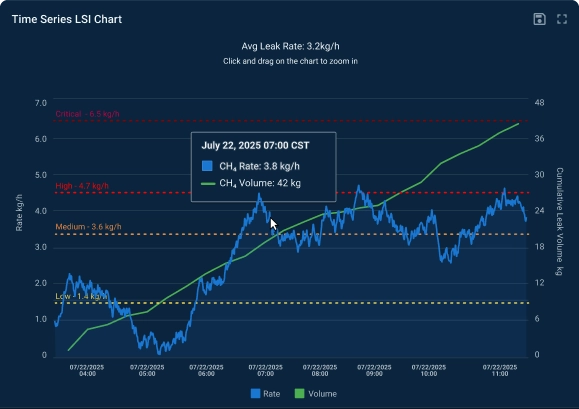
Move beyond a simple leak alert to understand what is happening over the complete lifecycle of an emission event.
- Visualize the emission source on a site map.
- Review individual events in a searchable table.
- Analyze average, maximum, and hourly leak rates as separate points of analysis.
- Use time-series charts to understand how an emission changes over time.
- Review event timing, duration, estimated rate, and total emitted volume.
- Maintain a historical, time-stamped record of emission events.
ACT
Focus Teams on the Events That Matter Most
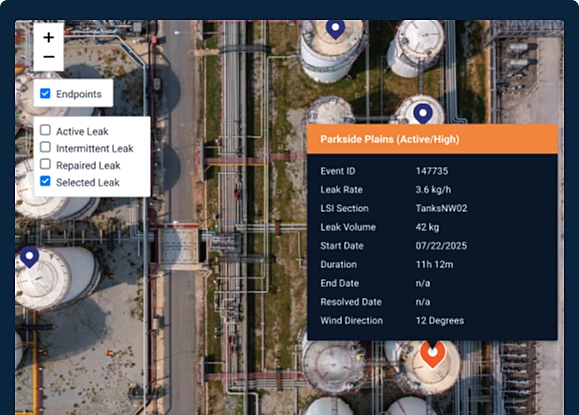
Not every emission event has the same operational or environmental impact. Clear classifications, configurable thresholds, and detailed leak-rate information help teams determine where action should be prioritized.
- Classify events using clearly defined severity levels.
- Evaluate emissions based on leak rate and CO₂e impact.
- Establish alert thresholds that reflect operational priorities.
- Automatically notify the appropriate personnel when an event meets defined criteria.
- Enable users to focus on the sites and assets within their areas of responsibility.
- Distinguish between operational and fugitive emissions to support an informed response.
REPORT
Establish a Baseline, Track Progress, and Simplify Reporting
Turn continuously measured emissions and equipment-status data into reliable records for operational, corporate, and regulatory reporting. Flexible reports help teams understand past performance, demonstrate monitoring continuity, and measure improvement over time.
Automated Emissions Reporting
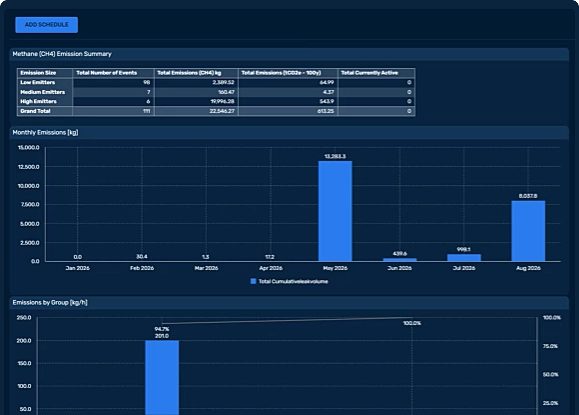
Create a clear, traceable record of emission events across individual assets, sites, regions, or the entire enterprise.
- Establish a methane emissions baseline.
- Automatically calculate and summarize emissions.
- Track event timing, duration, location, leak rate, and total emitted volume.
- Analyze historical emissions and identify trends.
- Filter reports by asset, site, region, date, event classification, and other criteria.
- Support regulatory compliance and reporting.
- Export data for additional analysis, corporate reporting, carbon accounting, and regulatory submissions.

Document Monitoring Continuity
Equipment uptime reporting demonstrates whether the monitoring network was operating throughout the selected reporting period and identifies potential gaps in coverage.
- Review equipment and site uptime over selected time periods.
- Document the operational status of monitoring equipment.
- Identify interruptions that may have affected monitoring continuity.
- Maintain equipment-uptime records alongside emissions data.
- Provide greater context and confidence in reported emissions results.
PRODUCTS
Emissions Intelligence Tailored to Your Application
MethaneTrack™
Continuous emissions monitoring for methane.
MethaneTrack™ is a highly scalable methane emissions monitoring solution that continuously detects, localizes, and quantifies emissions to provide teams actionable information to improve LDAR efficiency and supports methane reporting requirements.
EmissionsTrack™
Multi-gas continuous emissions monitoring.
EmissionsTrack™ is an automated continuous emission monitoring system for multi-gas emissions. Powered by TruePPM™ chemometric sensing, it detects, locates, and quantifies leaks across Hydrogen and all Hydrocarbons.